Step 8. Velocity
You can measure the average velocity by marking a section of the trace by dragging the mouse with the left mouse button held down.
Press the equals (=) key or button to calculate the average cbv over the marked period.
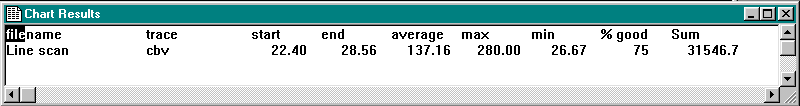
Note that periods where the correlation is poor, cbv is set to zero, and zero points, are, by default, excluded from the average result. The ratio of data points with good correlation to poor correlation is shown in the % good column.
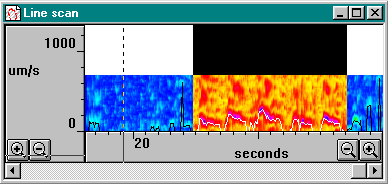
The coloured trace in the linescan window is a correlellogram trace. High correlation is shown as red, and low correlation as blue, with a rainbow spectrum for values in between. Velocity is on the vertical axis.