Example Sublingual Measurement SOP
This SOP is based on recommendations in :
How to evaluate the microcirculation: report of a round table conference
Daniel De Backer, Steven Hollenberg, Christiaan Boerma, Peter Goedhart,Gustavo Büchele, Gustavo Ospina-Tascon, Iwan Dobbe and Can Ince
Critical Care2007, 11:R101 (doi:10.1186/cc6118)
http://ccforum.com/content/11/5/R101
Initial Setup
Recording
De Backer recommends to make five recordings of 20 seconds at five different sites to provide at least three good videos for analysis.
Recording Steps
Click on the CapiScope HVCS desktop icon.
For the CapiScope Select Profile box click OK
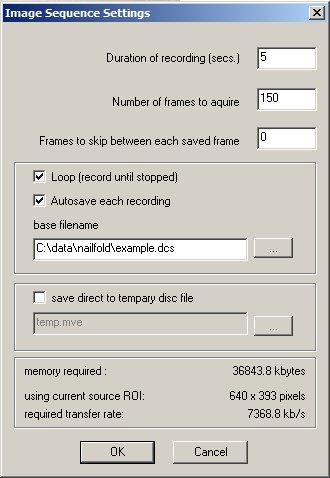
Set the duration to 20 seconds.
Enter a new base filename and path for recordings. (Use the
 browse button at right to browse and create new folders).
Click OK
Locate measuring site. Make sure to not exert too much pressure on the tissue.
Press
 record button or Trigger button to start recording
loop.
record button or Trigger button to start recording
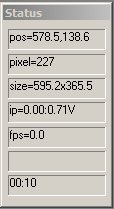
loop.Watch time elapsed as shown in bottom line of the status box.
Press the pause button or Trigger button to stop recording.
Goto 8 to start next recording with the same base filename.
Analysing Video
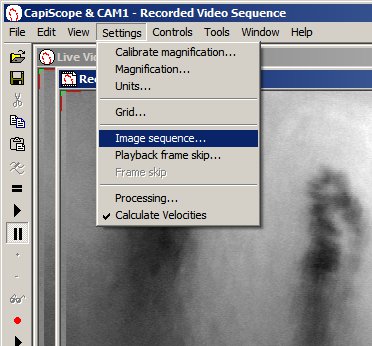
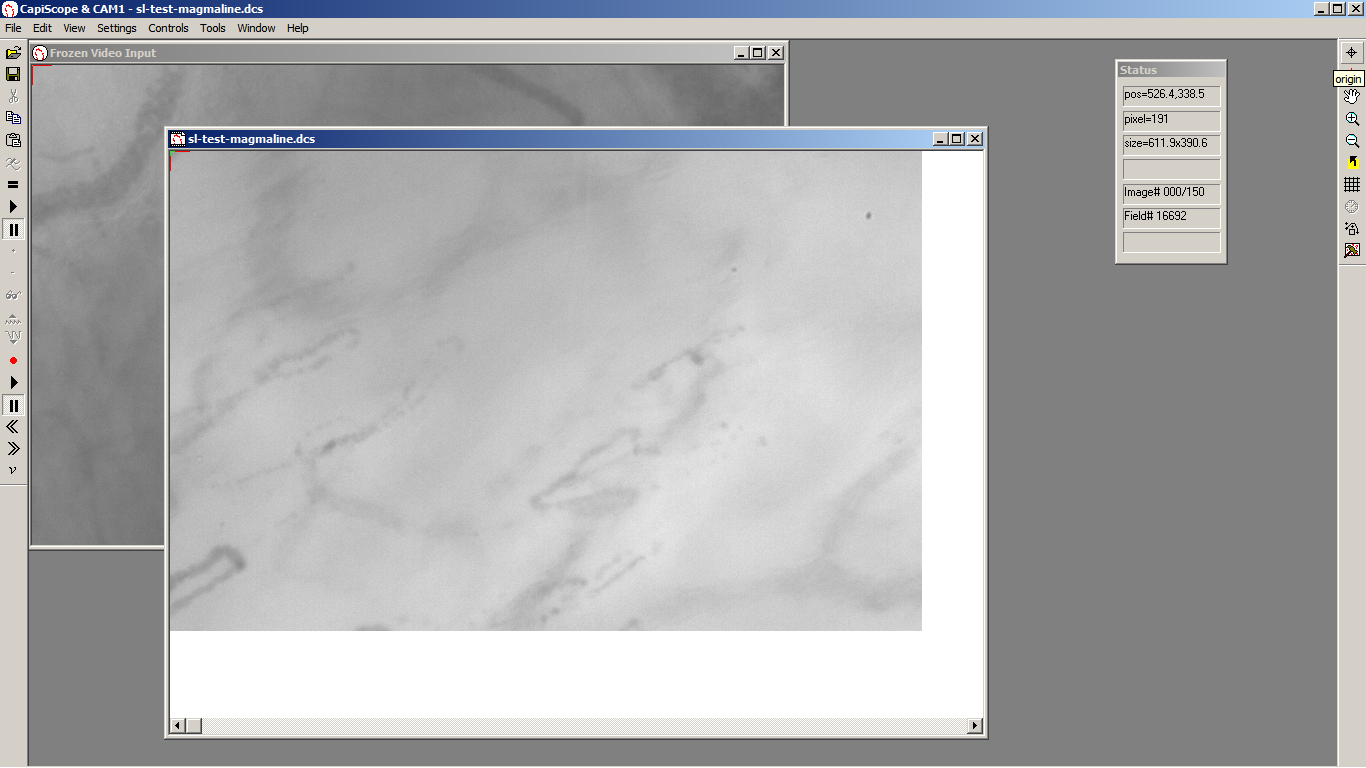
Open the video file.
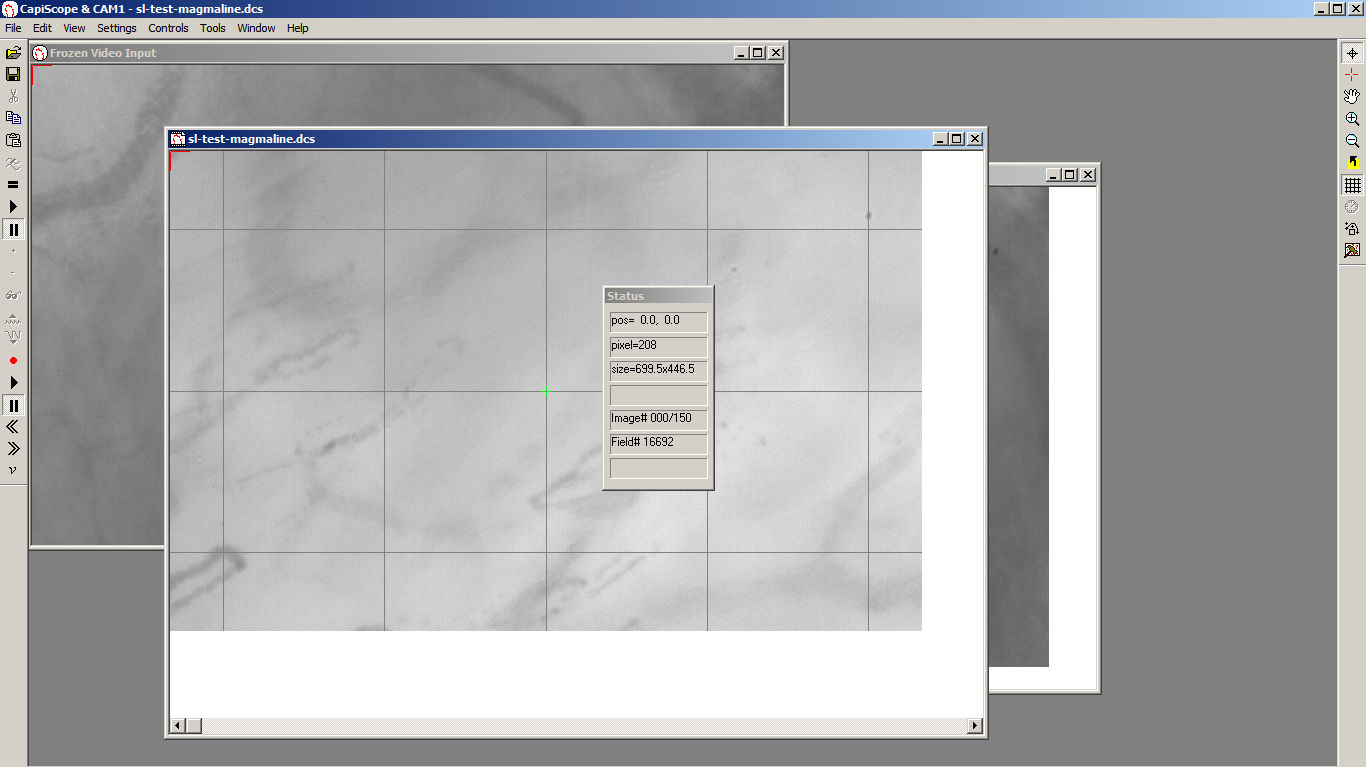
Click on the Origin button.
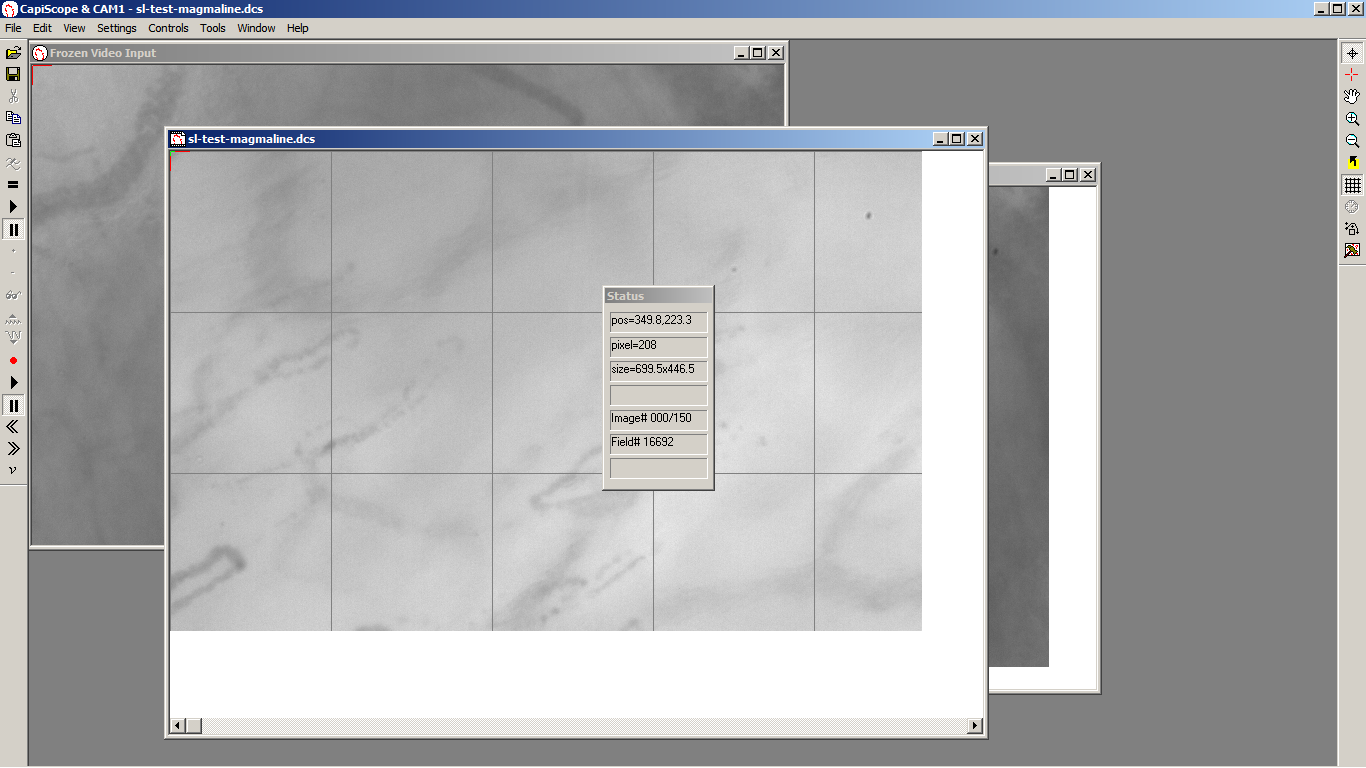
Move cursor to centre of image ( position about 350,223 ) and click to set the new origin (grid is aligned to the origin).
Select Tools Automatic Movement Correction
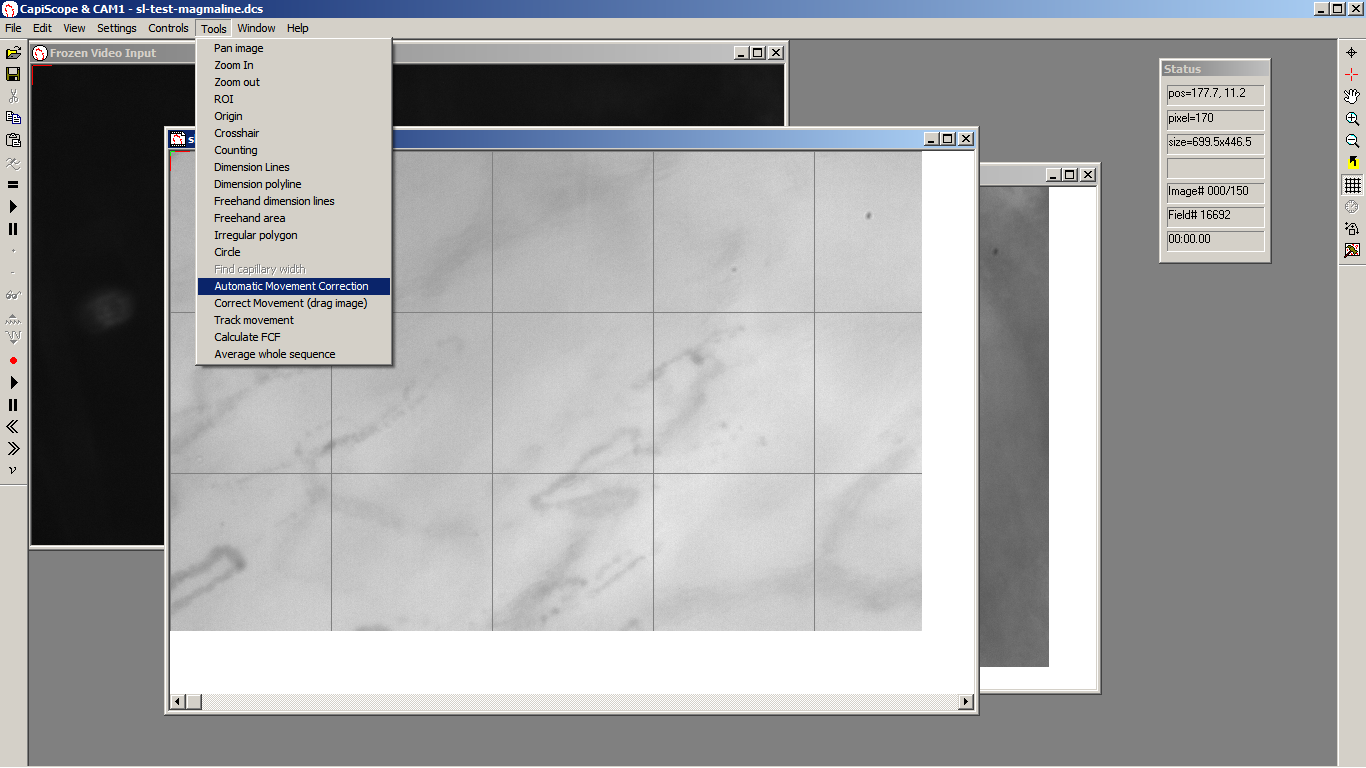 Press keyboard ctrl + L key to play video in a continuous
loop.
Press keyboard ctrl + L key to play video in a continuous
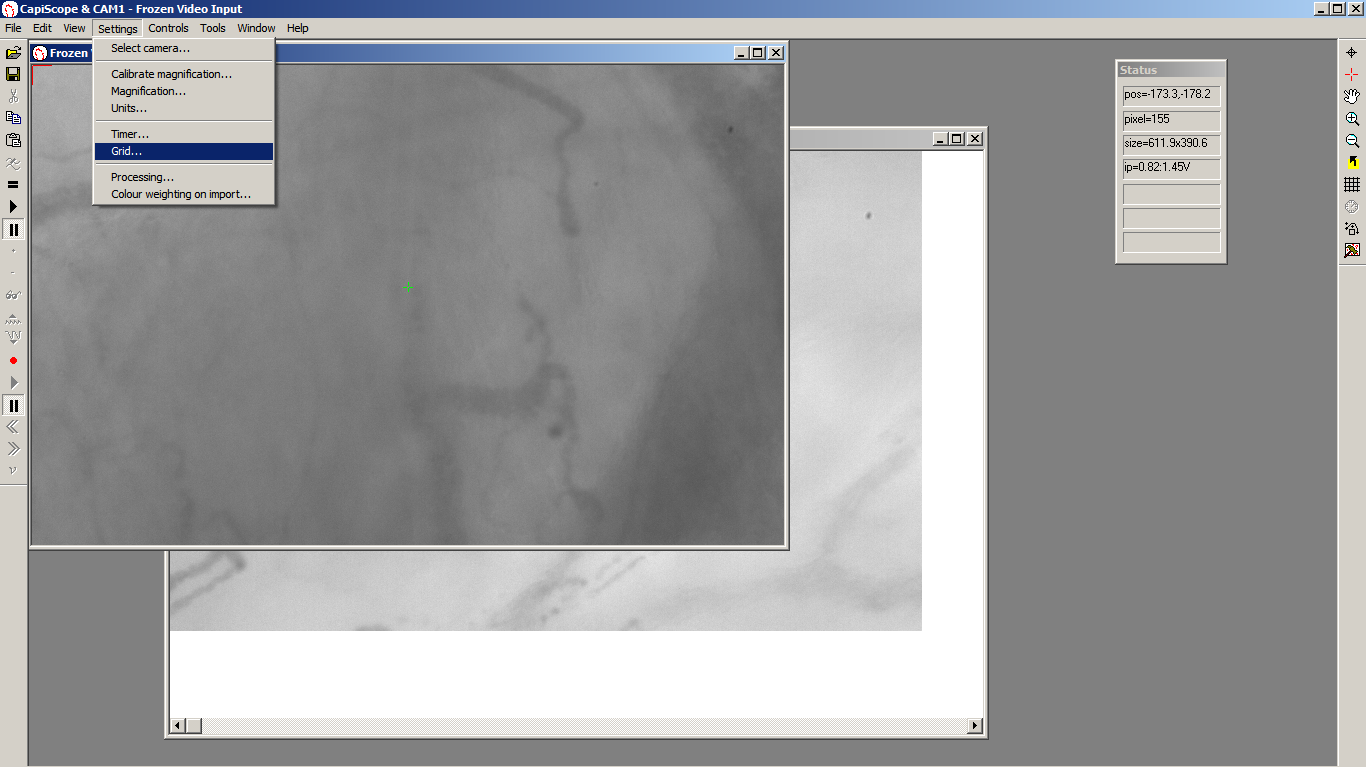
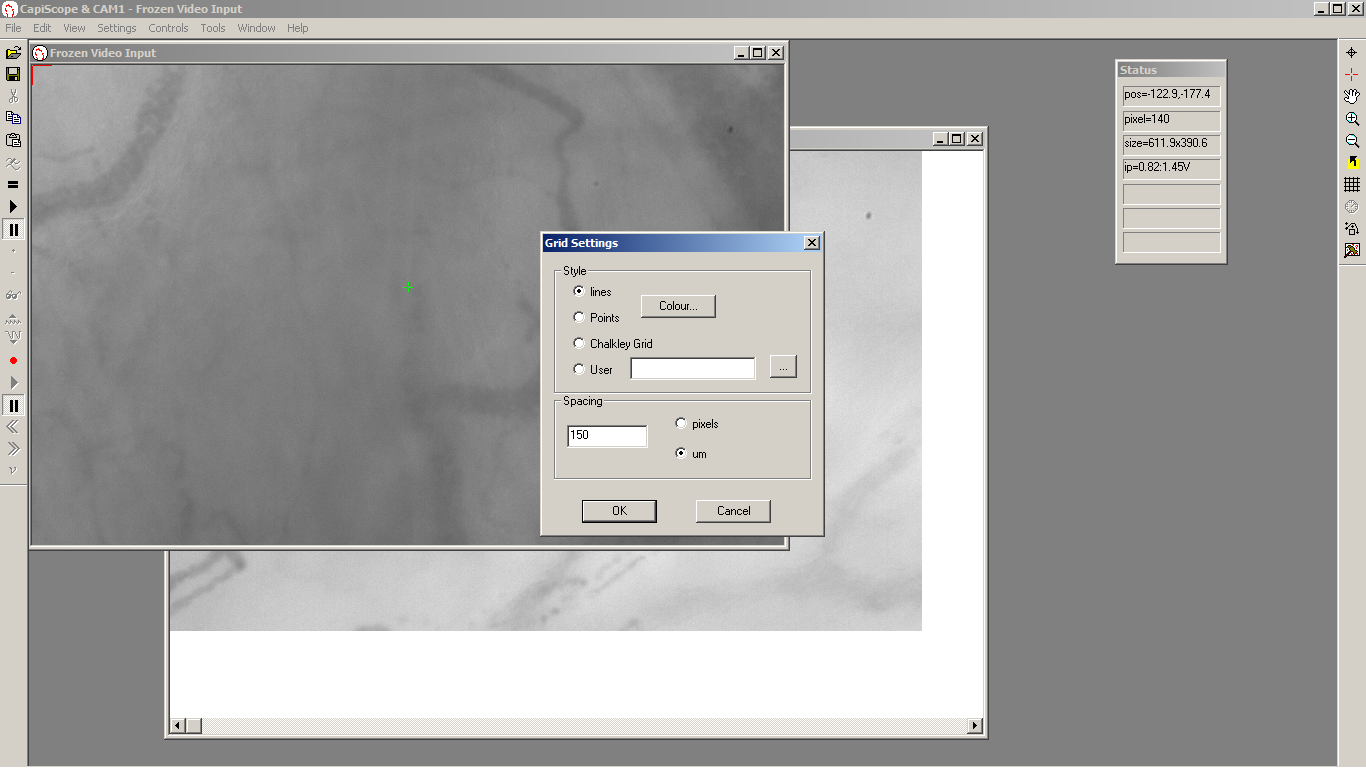
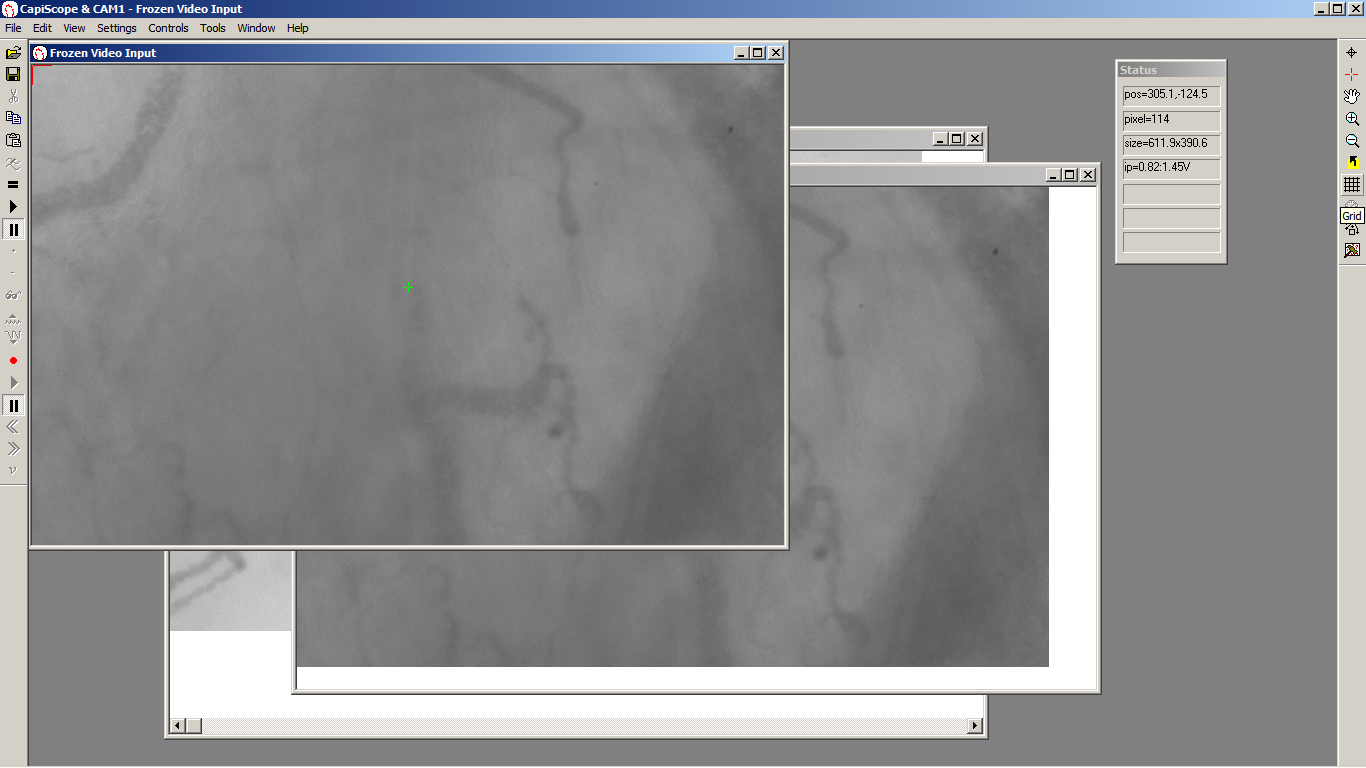
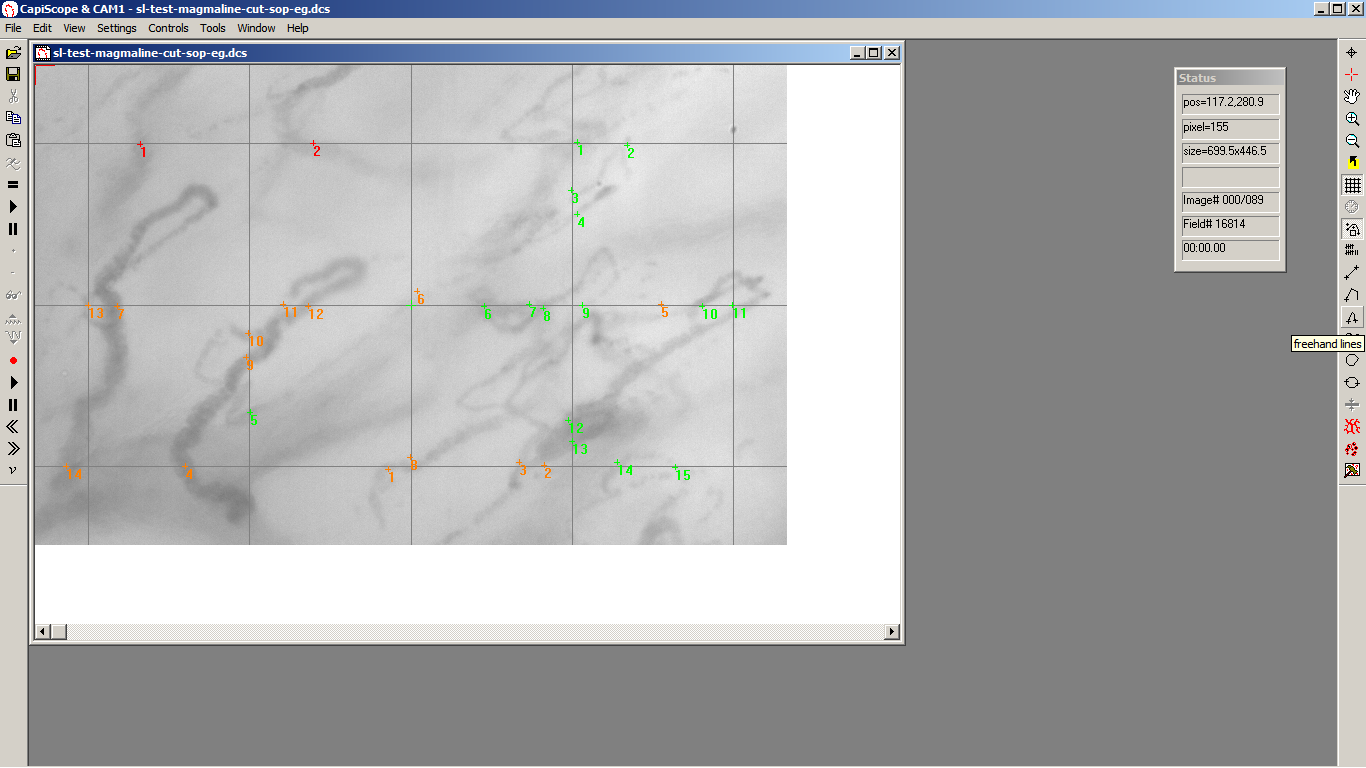
loop.Using the grid lines passing through the centre note the flow type for each quadrant for vessels <20 um and vessels > 20um.
Q1 |
Q2 |
Q4 |
Q3 |
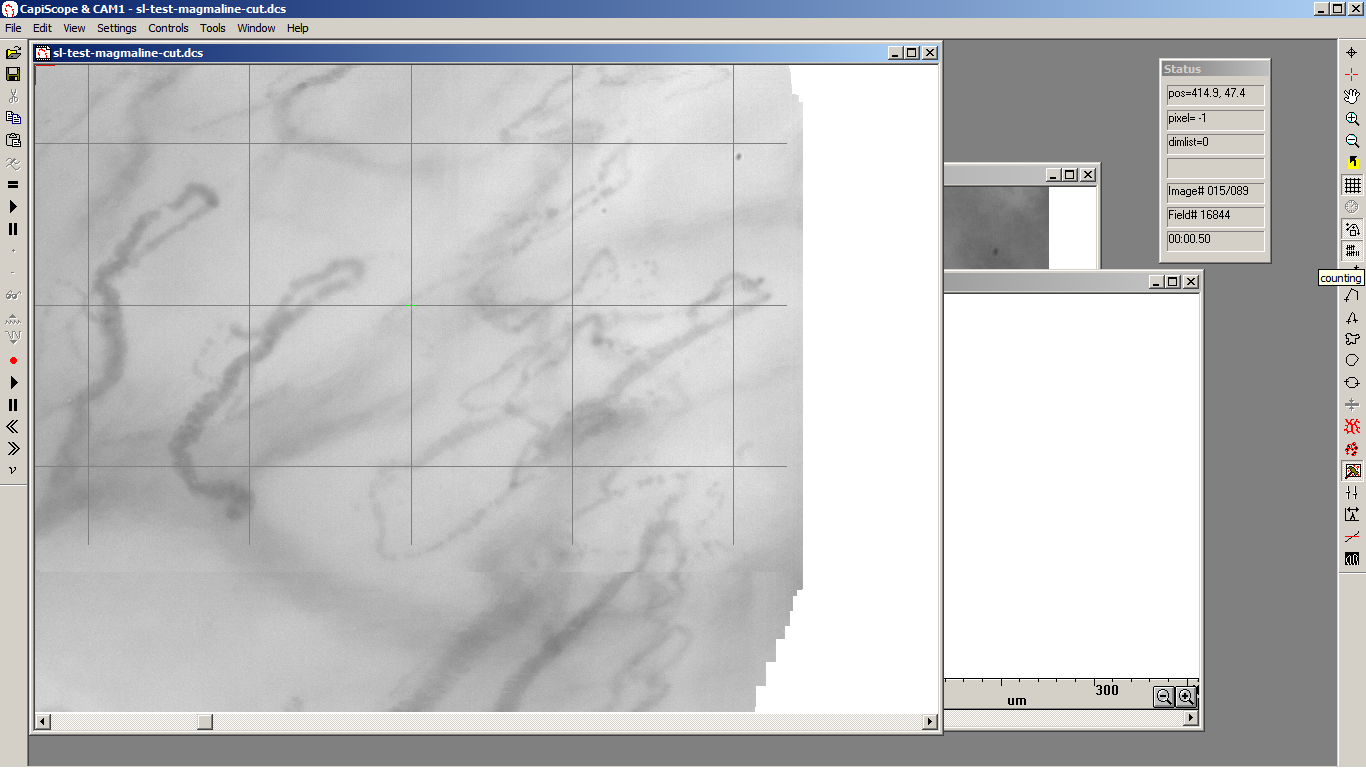
Click the counting toolbar button
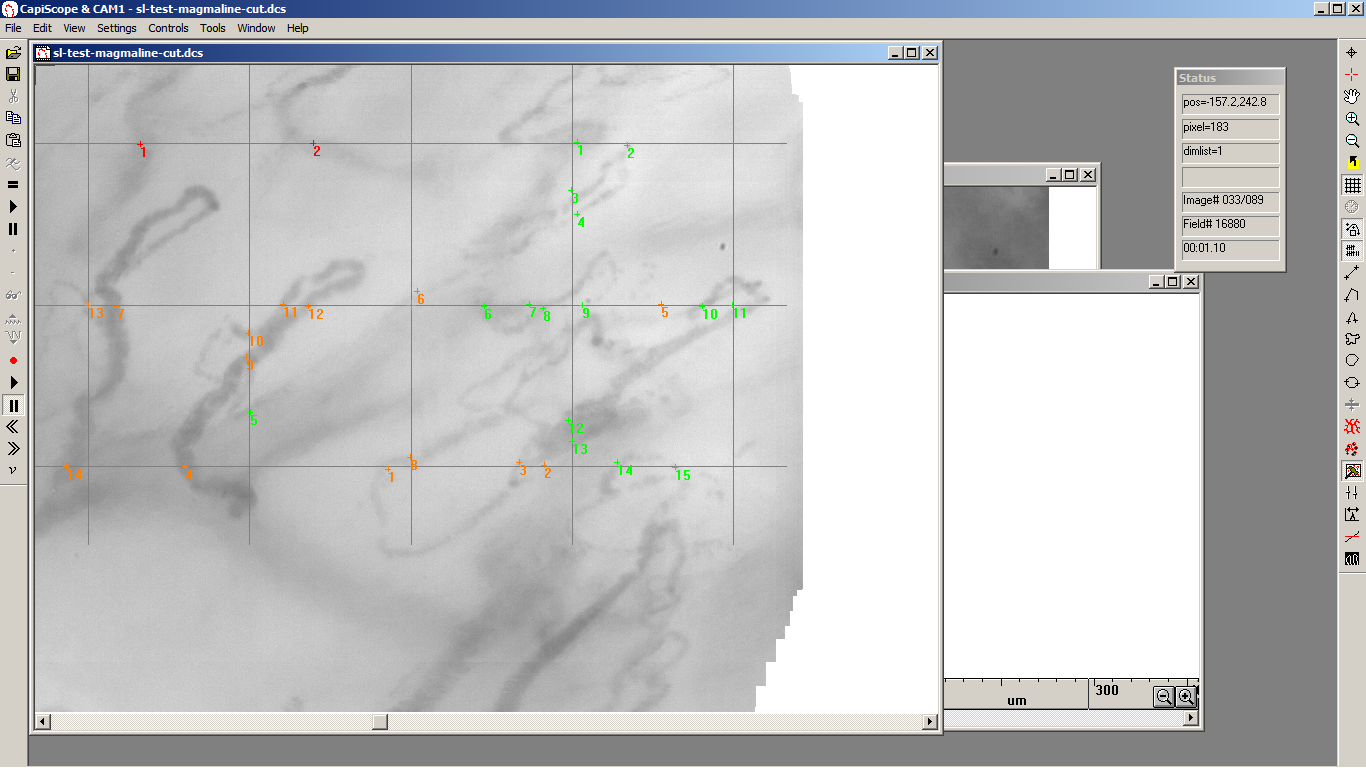
Click on all vessels <20um with no flow crossing the three central horizontal and vertical grid lines.
Press the keyboard D key to toggle to the list 1 dimension lines. The third line in the status box shows the current list selected.
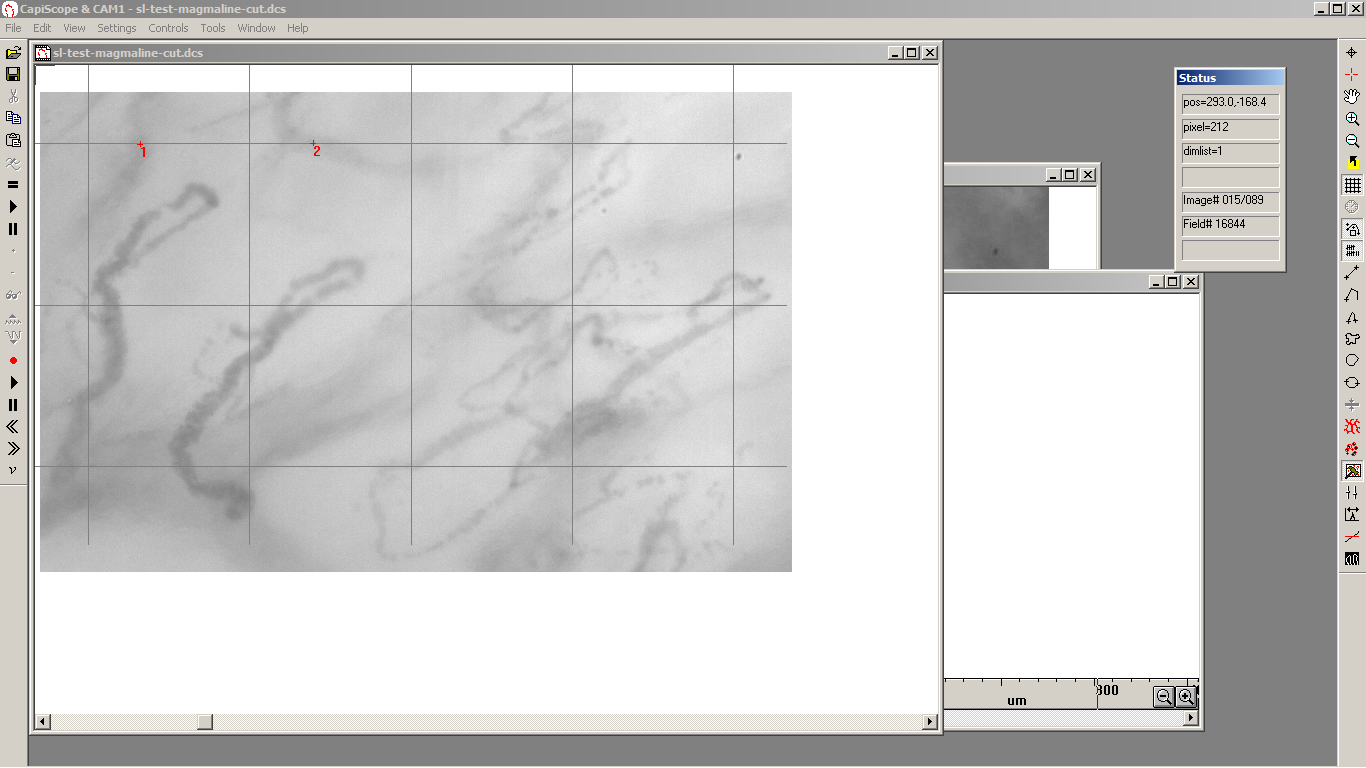 Click on all vessels <20um with intermittent flow
crossing the three central horizontal and vertical grid lines.
Click on all vessels <20um with intermittent flow
crossing the three central horizontal and vertical grid lines.Press the keyboard D key to toggle to the list 2 dimension lines.
Click on all vessels <20um with continuous flow crossing the three central horizontal and vertical grid lines.
Press the keyboard D key to toggle back to the list 0 dimension lines.
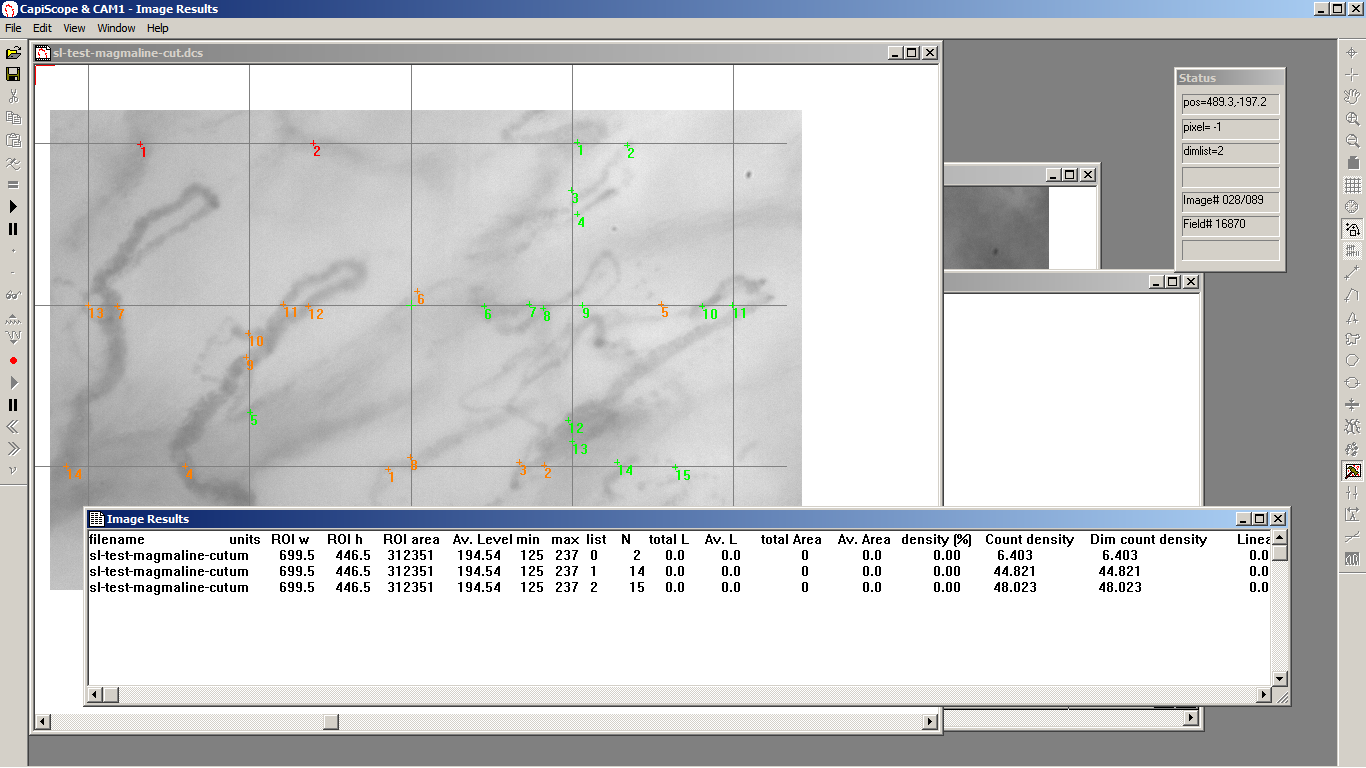
Press the = button or key. Repeat for dimension list 1 and dimension list 2.
The N column gives the number of crossings for each flow type, in this example 2,14, and 15.
Vessel density is calculated as the number of vessels crossing the lines divided by the total length of the lines.
In this example image size is 700 x 447 um,
therefore total length of the lines = 3 x ( 700 + 447 ) = 3441 um or 3.441 mm.
Vessel density = ( 15 + 14 + 2 ) / 3.441 = 9.0 mm/mm2.
Proportion of perfused vessels (PPV [%]) can be calculated as follows:
100 × (continuous flow])/total number of vessels.
In this example PPV = 100 x 15 / (15 + 14 + 2 ) = 48.4 %.
Perfused vessel density (PVD), an estimate of functional capillary density (FCD), can be calculated by multiplying vessel density by the proportion of perfused vessels.
In this example PVD = 9.0 x 48.4% = 4.4 mm/mm2.
Repeat steps 8 – 18 for vessels > 20 um.
Additional Microvision AVA parameters
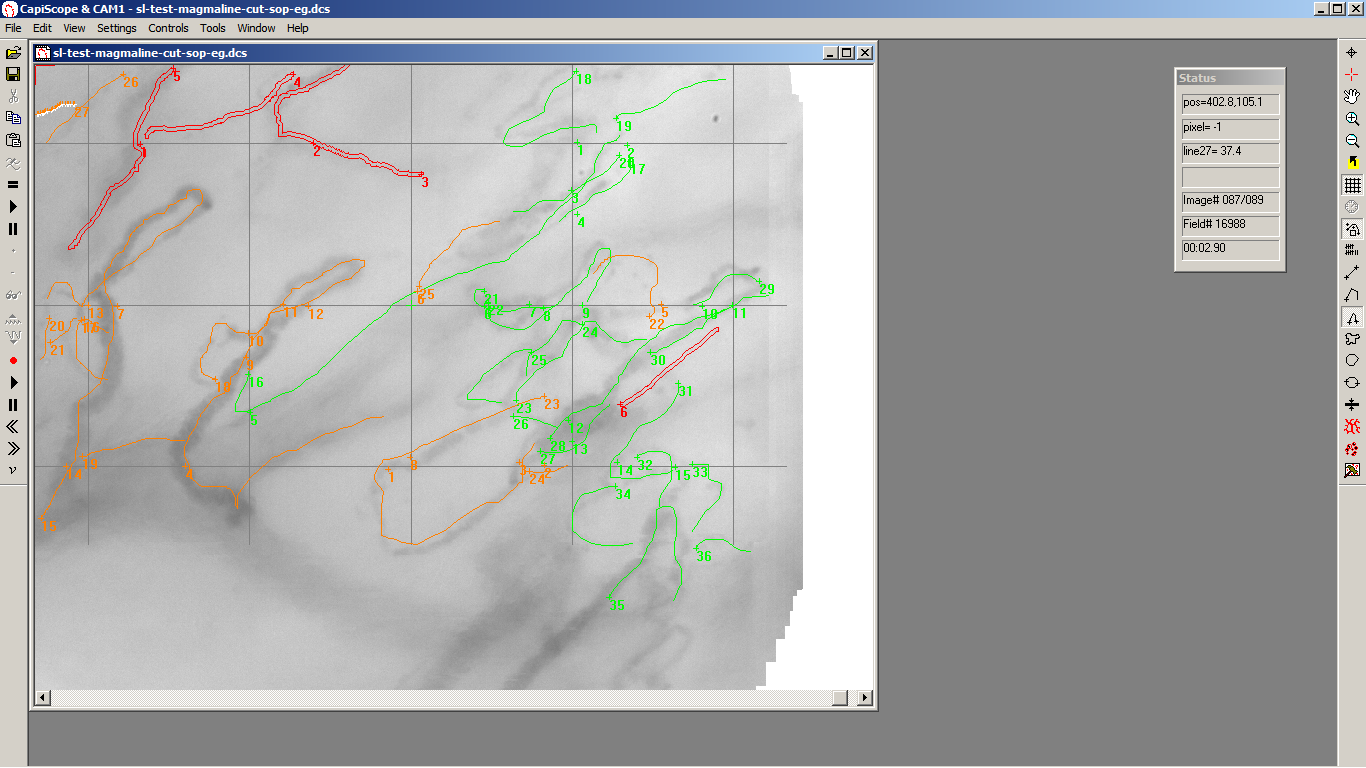
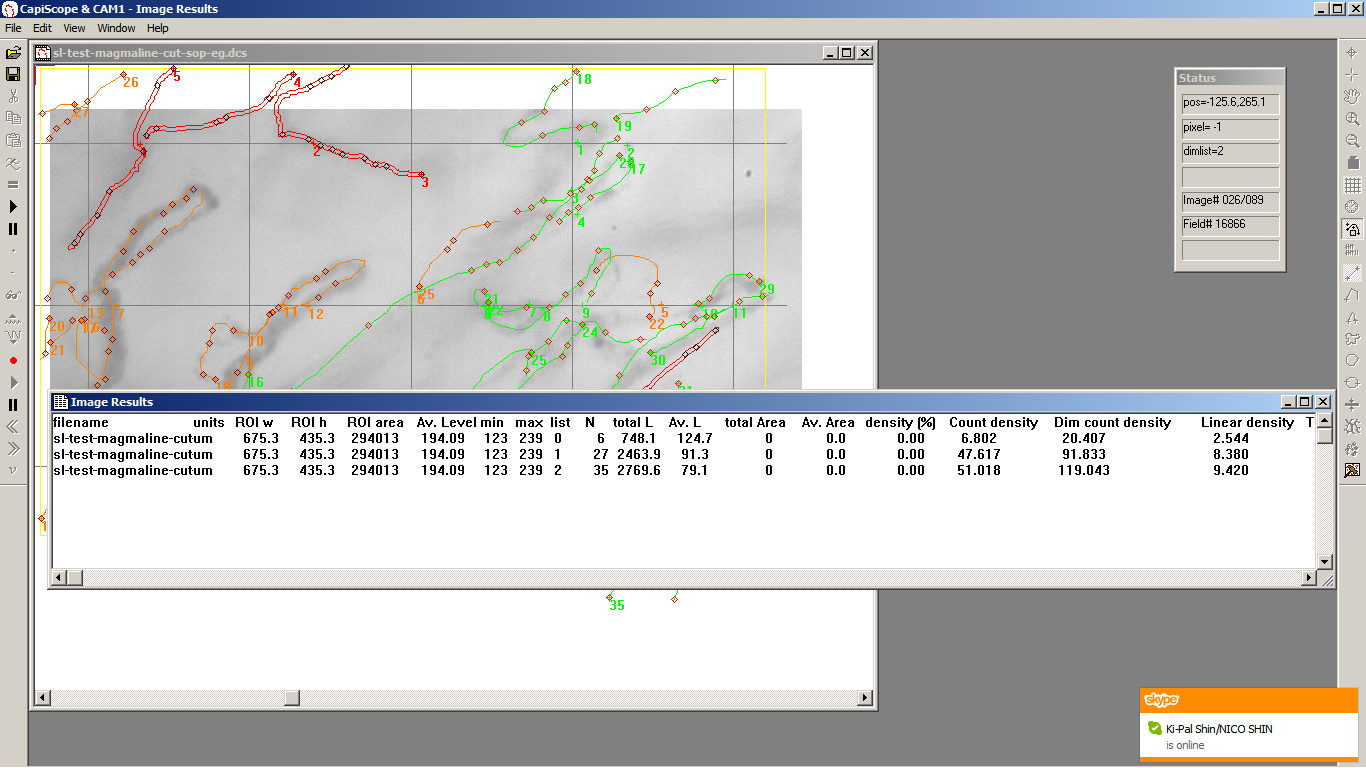
Use the freehand dimension tool.
Trace all vessels < 20 um with no flow.
Toggle the dimension list to list 1 using keyboard D key.
Trace all vessels < 20 um with intermittent flow.
Toggle the dimension list to list 2 using keyboard D key.
Trace all vessels < 20 um with continuous flow.
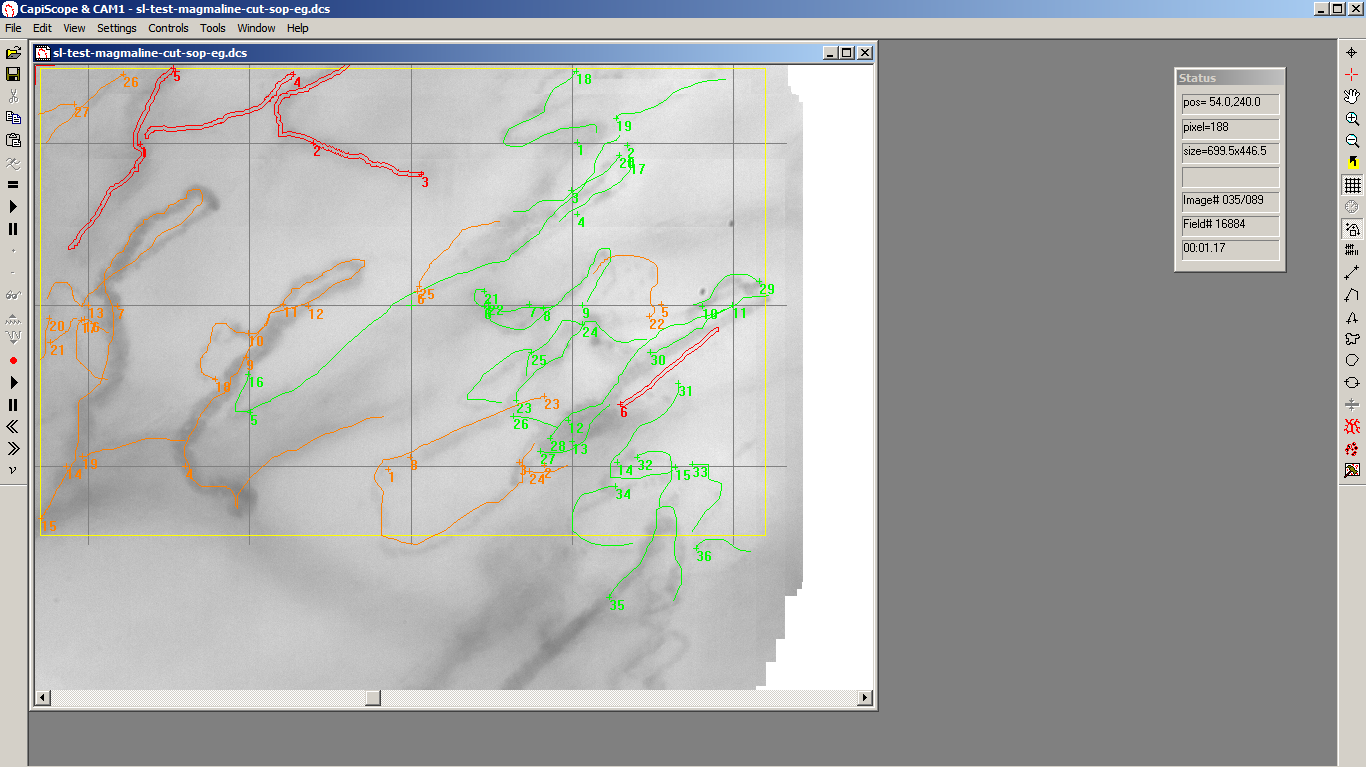
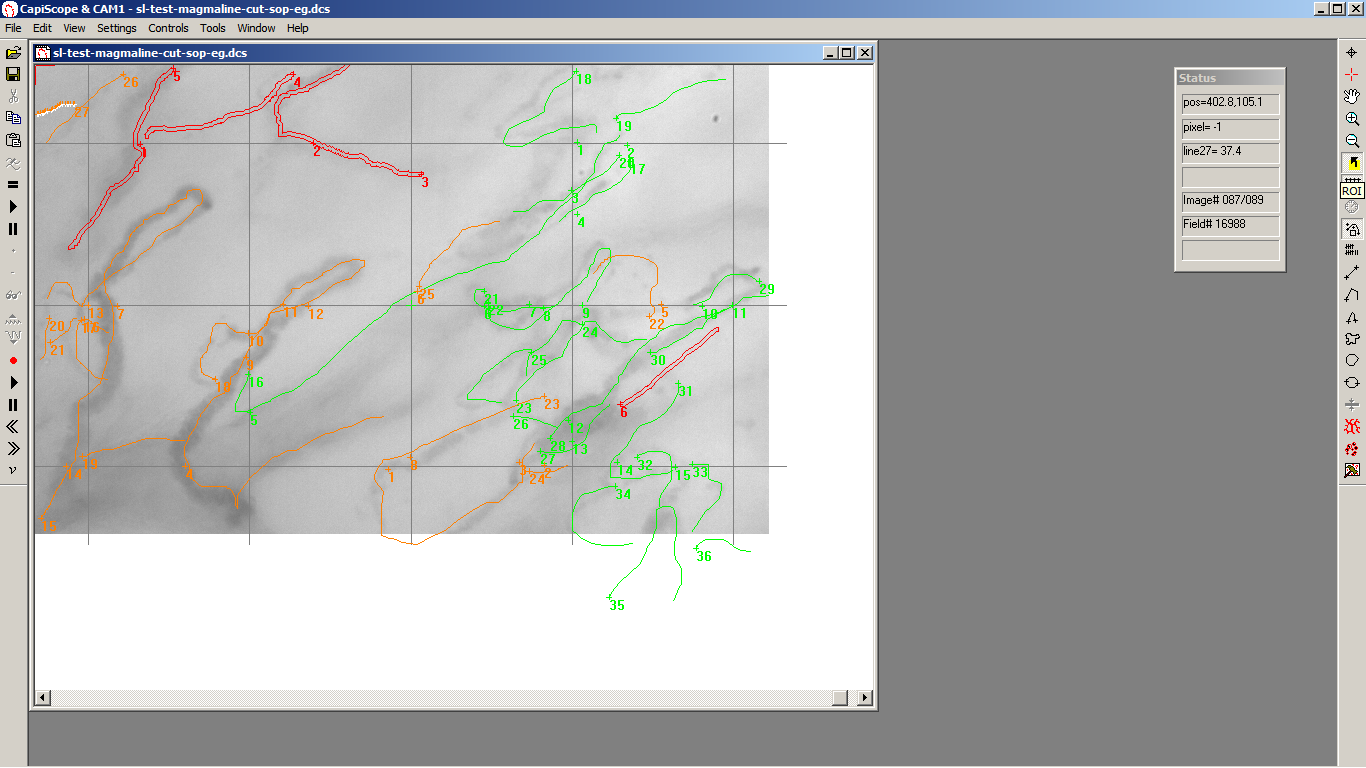
If necessary because of movement, select a region of interest (ROI).
Press keyboard D key and = for all 3 dimension lists.
Using the Linear density column in the Image Results table, Total Vascular Density is the sum of all 3 lists.
In this example: TVD = 2.5 + 8.4 + 9.4 = 20.3 mm/mm2.
PVD will be the linear density result for list 2, continuous flow.
In this example PVD = 9.42 mm/mm2.
PPV is calculated as 100 x PVD / TVD.
In this example PPV = 100 x 9.42 / 20.3 = 46.4%
Repeat steps 20 – 31 for vessels > 20 um.
