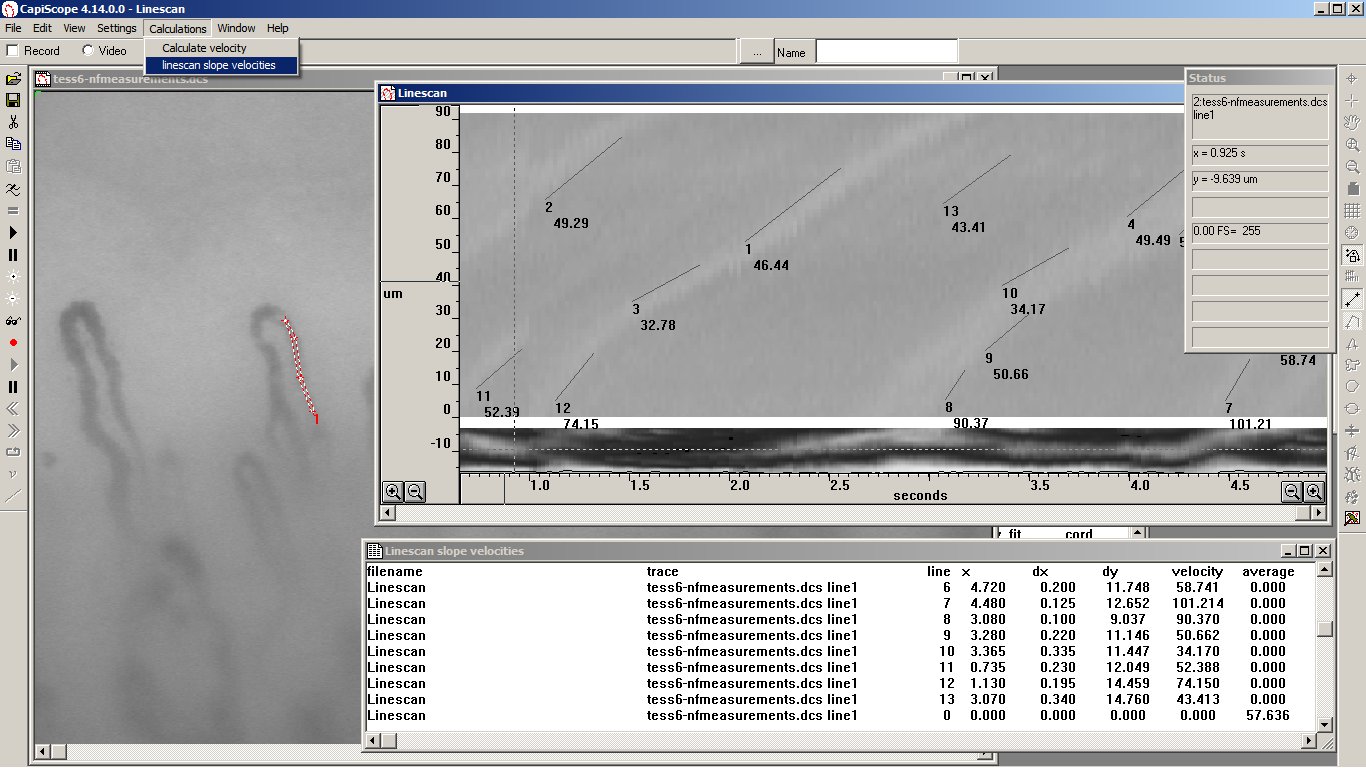
Linescan Window
Velocity slope measuring lines
Use the Dimension Lines toolbar button to draw lines along slopes in the linescan trace.
Use the menu Calculations linescan slope velocities function to output a list of velocities and time of the first point for each line. The final line shows the average of all velocity measurements (not dependant on the length of the measurement lines).
Lines will be deleted when restarting play of the video, or selecting a new measurement line.
Lines will be saved with the linescan window. If inserting more than one linescan into a linescan chart, the lines use the scaling and offset values of the first linescan trace found (i.e. using ygroup 111).

