Tortuosity
All freehand or polyline dimension lines with at least three points are analysed for tortuosity. Draw a line along the centre or edge of each vessel from end to end.
Two tortuosity methods are used:
Tort0
This is a simple tortuosity measure of the ratio of vessel length to chord length, where chord length is the shortest straight line length between the two end points.
This is a dimensionless measure.
Tort1
This uses a method described in: Enrico Grisan, Marco Foracchia, Alfredo Ruggeri. A novel method for automatic evaluation of retinal vessel tortuosity. Proceedings of the 25th Annual International Conference of the IEEE EMBS, Cancun, Mexico, 2003
The dimension line is split into N curves. The start/end of each curve is found by a change in curvature on the line. Then sum of the ratios of curve length to chord length ( Li / Si ) is used to determine total tortuosity.
Dimensions are 1 / length i.e. µm-1
Configuration ini file settings are used to reduce noise:
[tortuosity]
minlength=10
minangle=5
mincurvelength=20.0
log=0
where:
minlength |
Minimum length (in µm) before testing for change of angle |
minangle |
Minimum change of angle (in degrees). Only angle changes above this value are considered. |
mincurvelength |
Minimum curve length (in µm) between changes in curve. |
log |
0= no logging. 1= log angle and length calculations to the log file. |
These configuration settings are read each time a CapiScope image file is opened. If you want to experiment changing these values, edit the ini file (same base filename and folder as the executable, e.g. c:\KKTechnolgy\CapiScope\kkcapiuSC.ini ).
Result Output
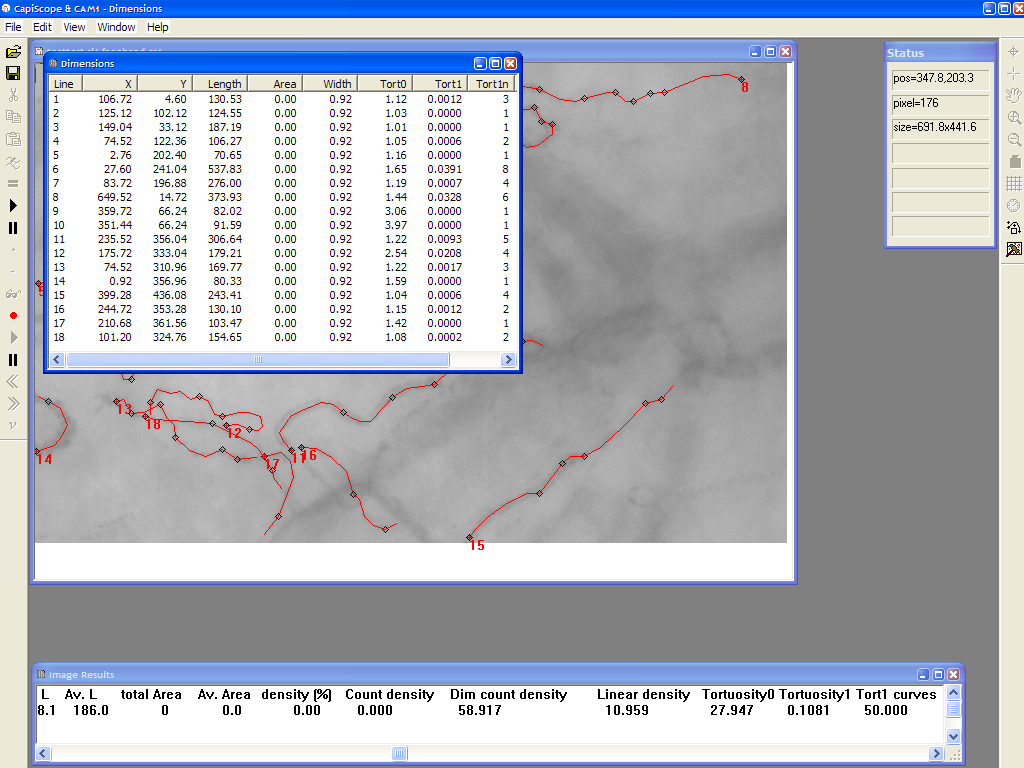
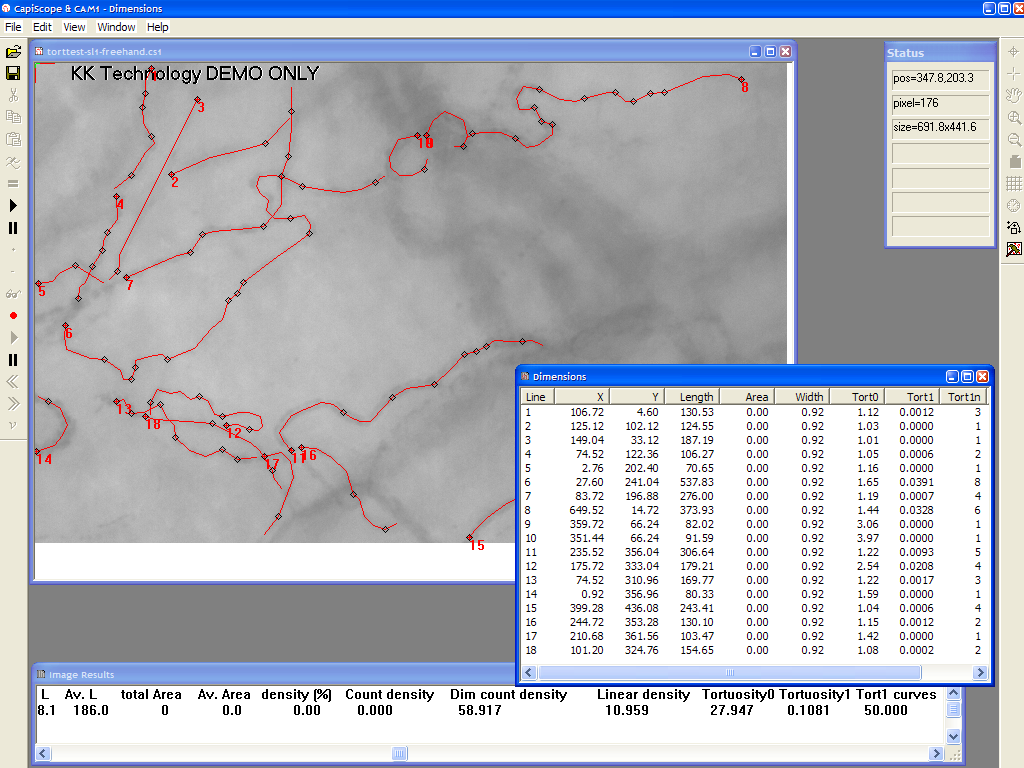
Individual Tortuosity results are shown in the “Dimension List”. Tort1n is the number of curves used in the tortuosity calculation. The Dimension List window is displayed by the menu “Windows”, “Dimension List”.
The Dimension list can be saved using “File”, “Save”. The file is a standard “csv” comma separated variable text file which can be opened in Excel or OpenOffice.
The total tortuosity for the whole image is calculated by using the
 toolbar button or the “=” key.
Data in the “Image Results” window can be selected, copied and pasted into other applications such as Excel.
 Changes in curvature direction are shown as black diamonds on
the dimension lines. There might be more marks than indicated by the
tort1n value since the curvelength value might be less than the
configuration minimum for some of them.


